User Review
( votes)
Introduction:
The “Customer Service Insights” is now embedded in the Dynamics 365 customer service with the inbuilt AI capabilities. In the previous blog, we have already seen the “Customer service historical analytics” report which helps the service agents and managers to view historical analytics directly within the customer service.
In this blog, we will have a walkthrough of another such AI-driven out-of-the-box report called “Knowledge Analytics”.
The knowledge analytics provides two inbuilt dashboards – “Search term insights” and “Article insights” – which are designed to provide knowledge article managers with valuable knowledge insights about how the customer support service agents are finding and using knowledge articles while working on any case. This allows the knowledge manager to see historical knowledge analytics directly within the Customer Service which helps to identify searches that are common and surfaces the knowledge base article successfully. It also helps to identify searches where the searched term displayed no results.
For this, in Dynamics 365 2021 release wave2, open “Customer Service hub”–> under the “Service” area–> go to “Insights”–> open the “Knowledge Analytics”.
When you try for the first time to view the report after turning on this from the “Service Management” area explained later, you might experience the below warning “Your reports are being provisioned. Please allow up to 24 hours for the process to complete.”
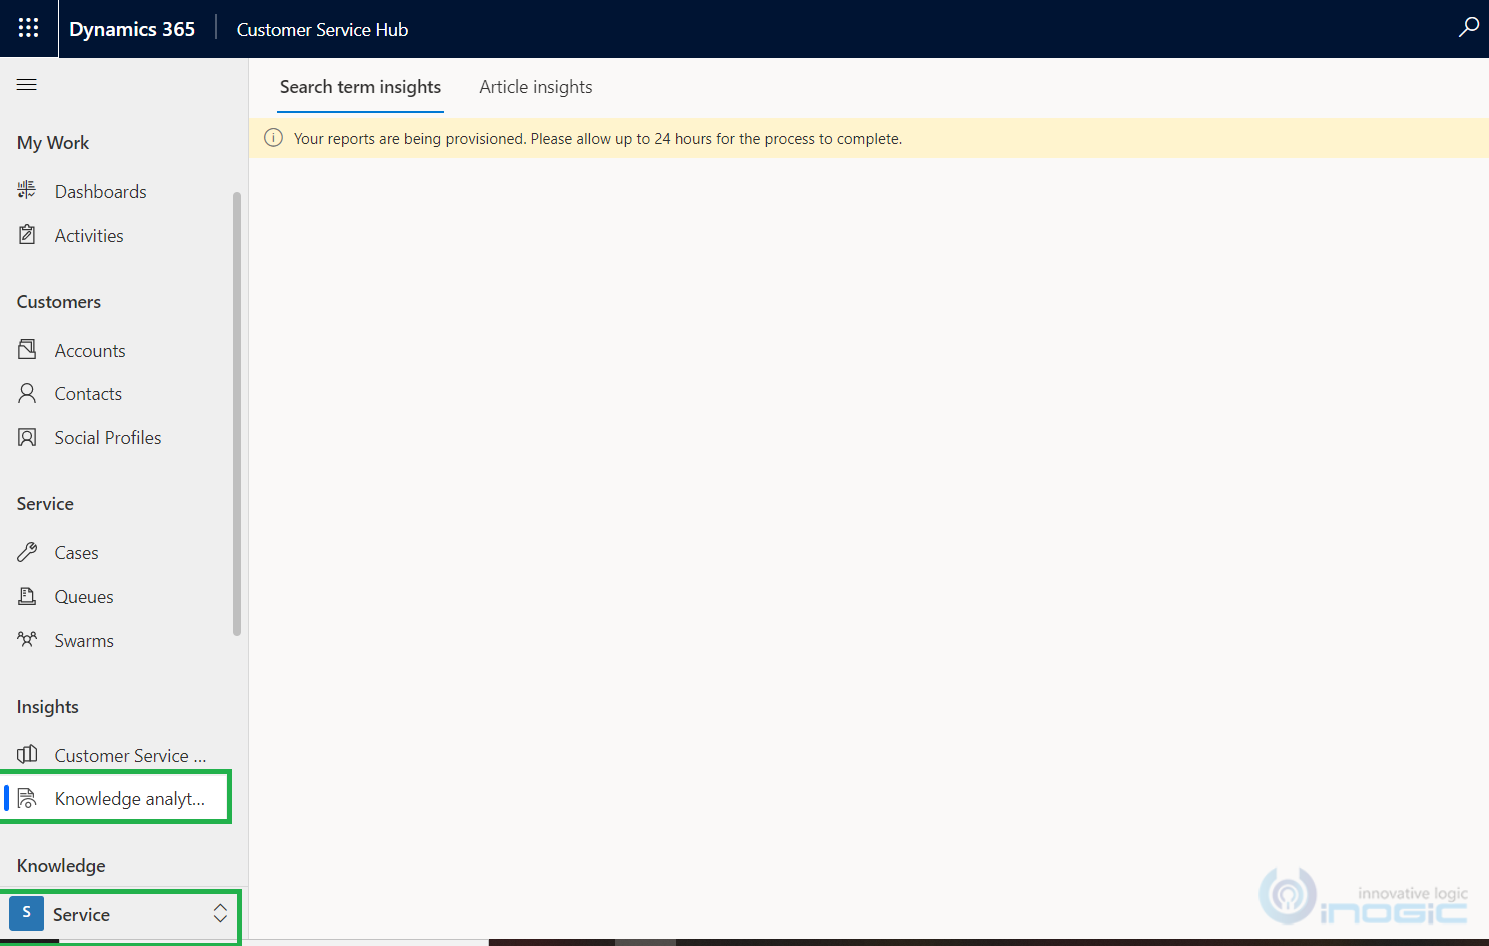
NOTE: Though provisioning time mentioned up to 24 hours, it took 3-4 hours while I was configuring. So, this provisioning time may vary for you.
How to turn on this feature?
You can navigate to the “Service Management” area–>under Insights–>Settings, the “Customer Service historical analytics” setting is available.
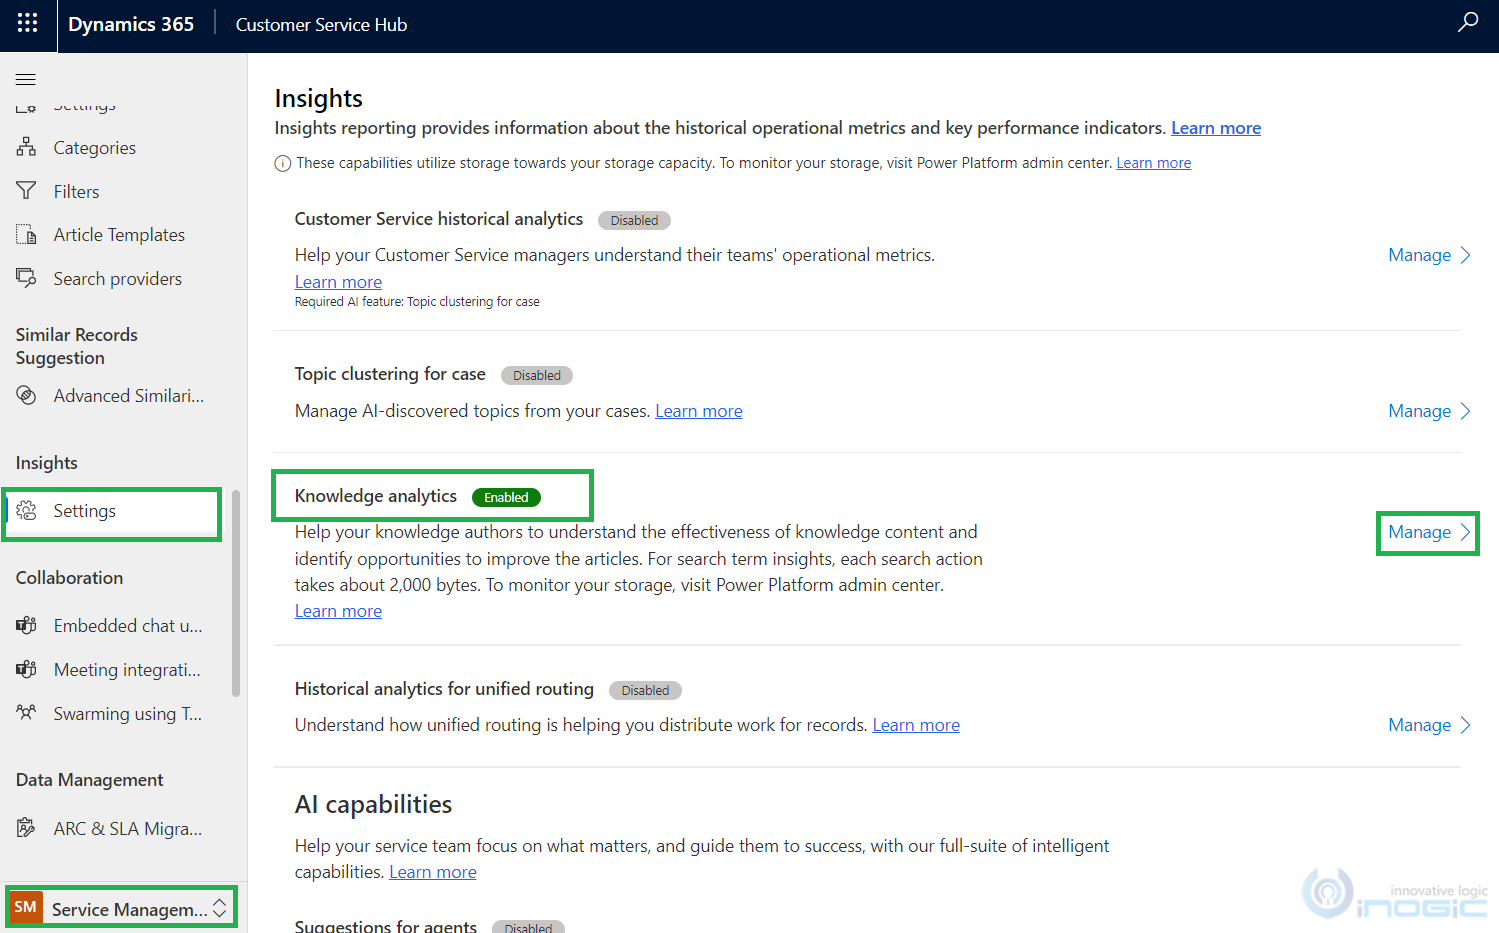
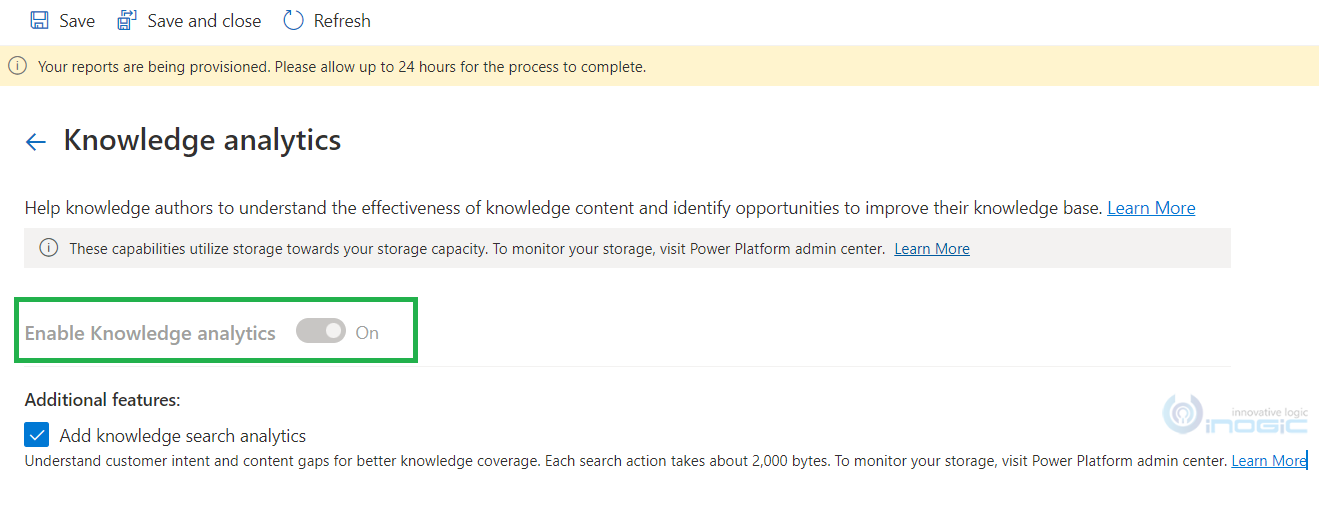
If you click on manage then you will observe there is setting available for turning it on.
You can refer to this doc for more details.
Once provisioning is completed, the report can be seen in two dashboard formats – “Search term insights”, and “Article insights”.
The following dashboard reports are available for “Knowledge analytics” reporting:
- Search term insights Dashboard – By default, the “Search term insights” dashboard is shown. This dashboard provides the overall summary and insights on how agents are finding and using knowledge articles.
Need – As a knowledge manager, one should keep an eye on the knowledge base search keyword and make sure it should return appropriate useful knowledge base articles with high success. That means the most relevant knowledge base articles should surface at the top. “Knowledge analytics” report helps in identifying the searches that are most common and also helps to identify the loopholes if any while searching the results.
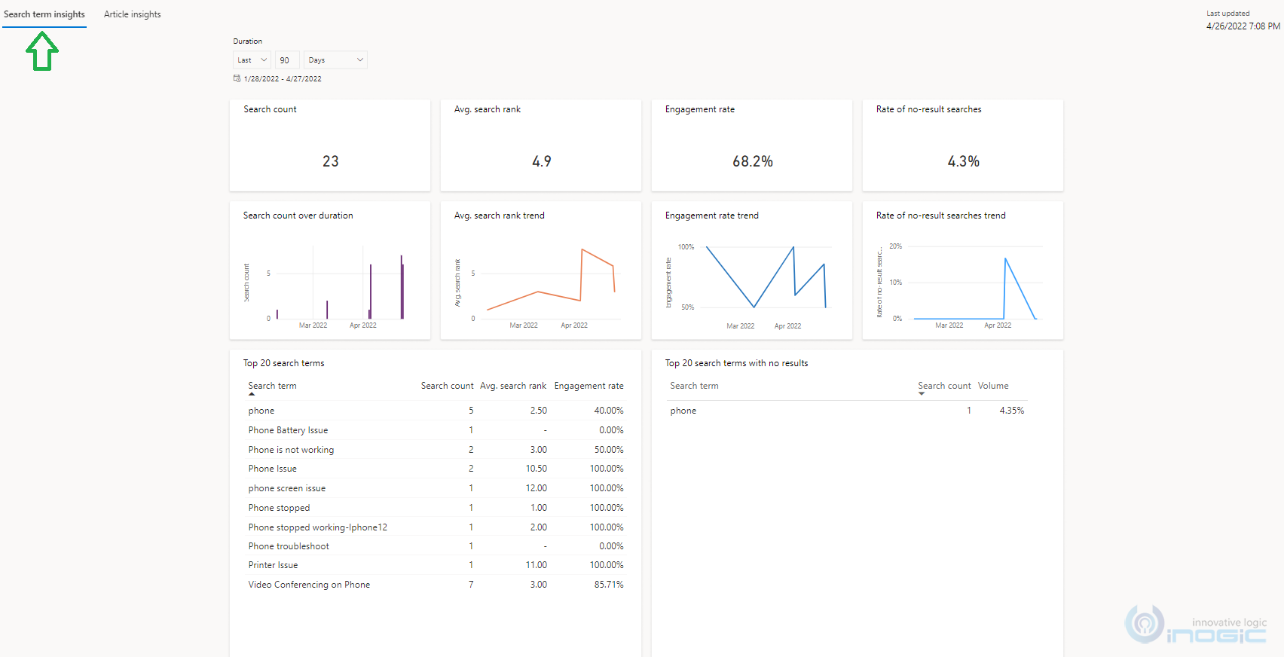
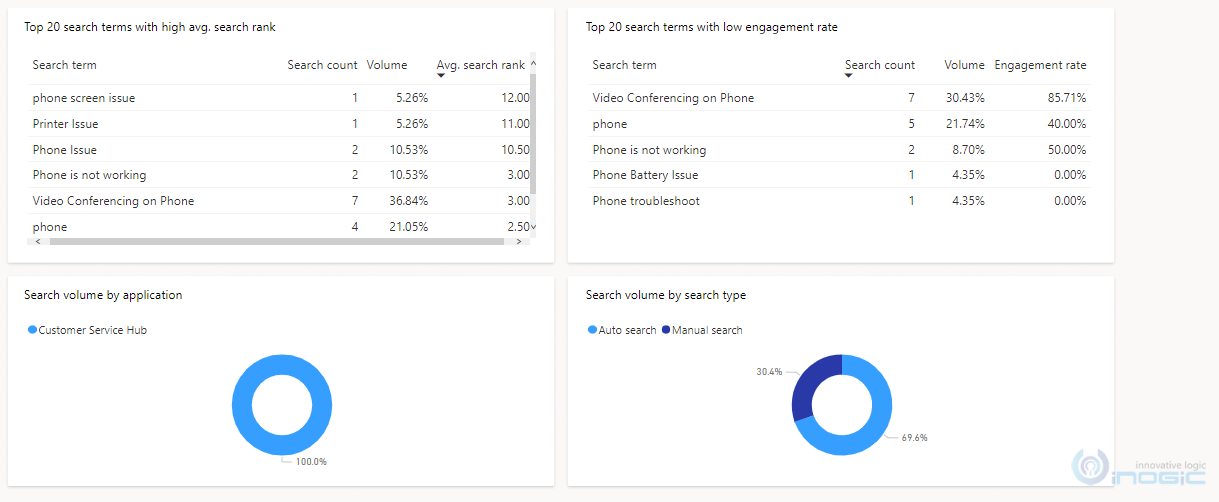
Filtering – You can filter information by selecting values from the “Duration” attribute. By default, the duration value is set to last 90 days.
KPIs – KPIs displayed in the report are “Search count”, “Search count over duration”, “Avg. search rank”, “Avg. search rank trend”, “Engagement rate”, “Engagement rate trend”, “Rate of no result searches”, “Rate of no result searches trend”, “Top 20 search terms”, “Top 20 search terms with no results”, “Top 20 search terms with high avg. search rank”, “Top 20 search terms with low engagement rate”, “Search volume by application”, “Search volume by search type”. For more details refer to this doc.
- Article insights Dashboard – This dashboard shows the overall impact that knowledge management is making on the overall support experience.
Filtering – You can filter information by selecting values from the “Duration” and the “Owner” attributes. By default, the duration value is set to last 90 days and the owner filtering is set to all.
Navigate to the “Article insights” dashboard as shown below:
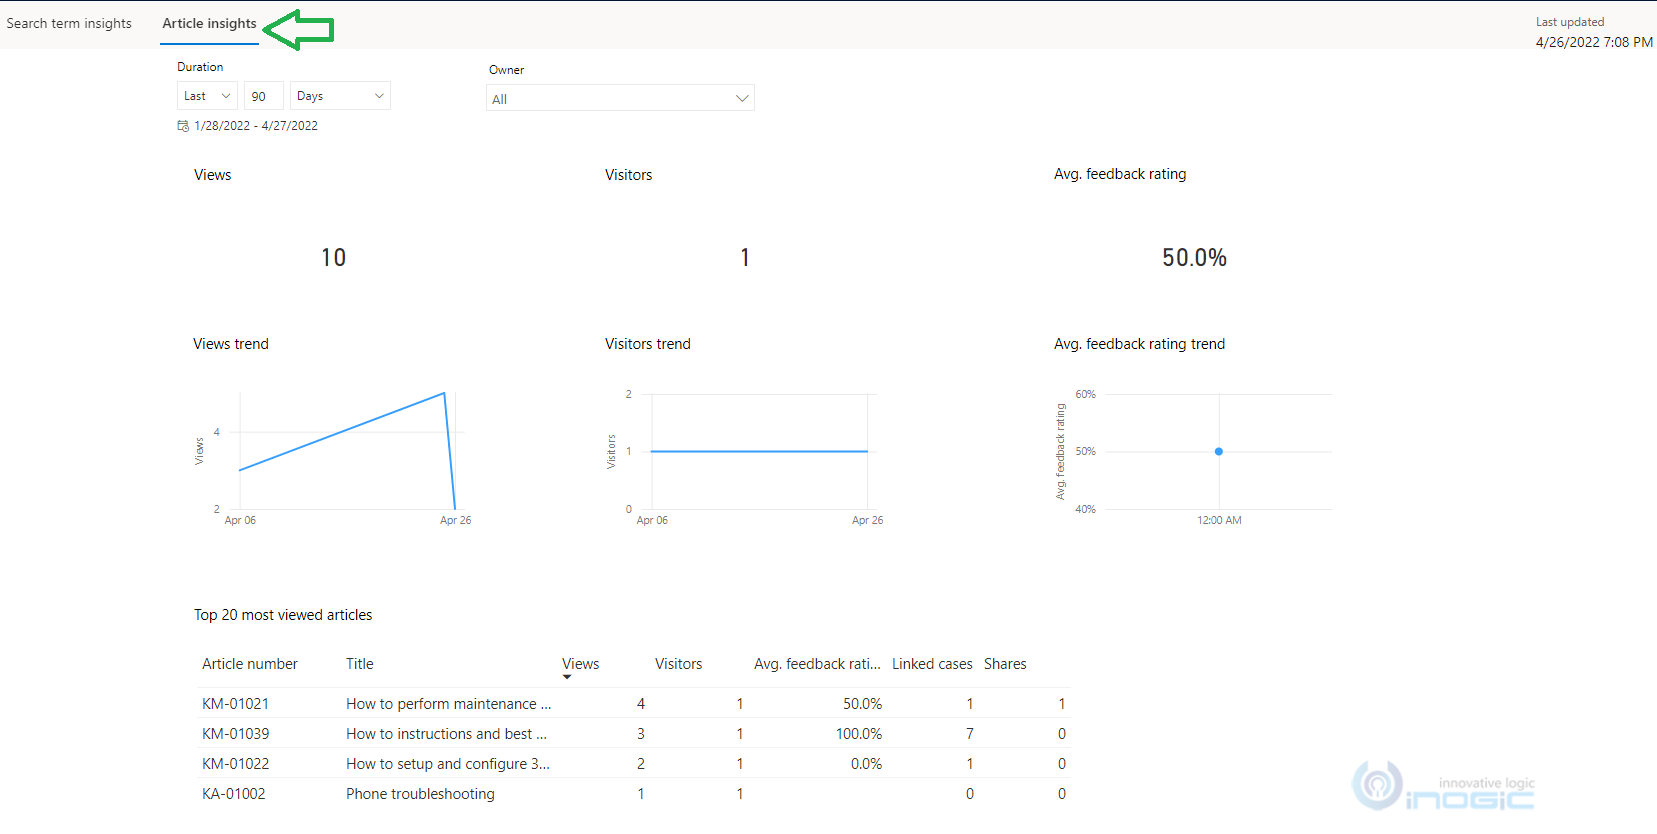
KPIs – KPIs displayed in the report are “Views”, “Visitors”, “Avg. feedback rating”, “Views trend”, “Visitors trend”, “Avg. feedback rating trend”, and “Top 20 most viewed articles”. For more details refer to this doc.
You can track of the “Views”, “Feedback” and “Linked cases” details through the “Analytics” tab from “Knowledge Article” entity.
NOTE: The report shows the cumulative result of all the “Knowledge Article” records present in the system.
For demonstration, I have opened “Knowledge Article” entity record as shown below:
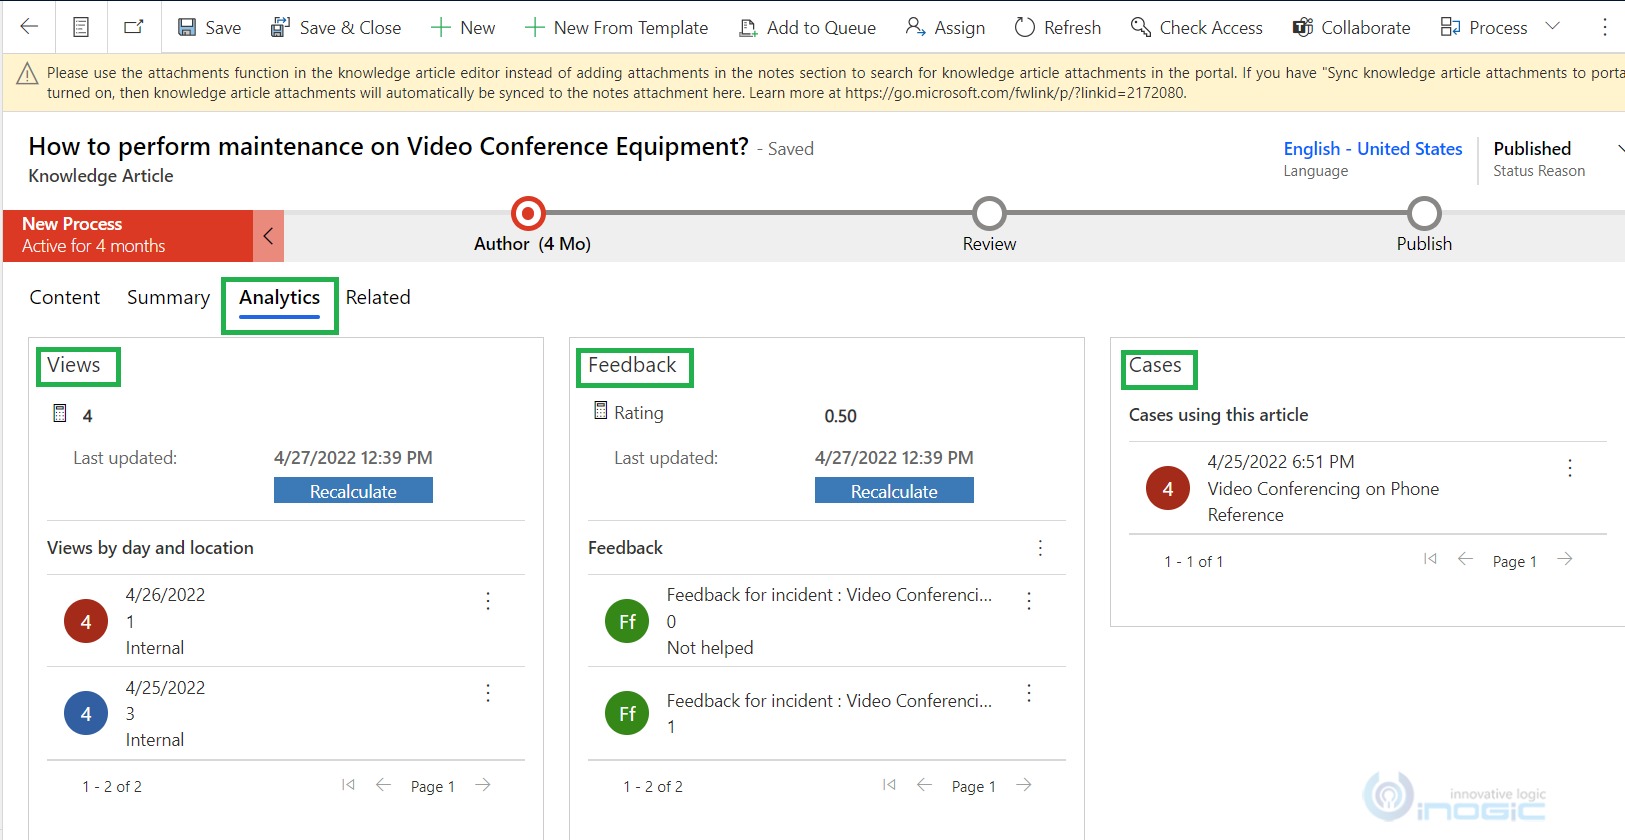
NOTE: With appropriate data, you will get more accurate visibility/insights in terms of KPI values and metrics on the dashboard.
Few things to keep in mind:
- Data Refresh happens after every 24 hours, the time when refresh is completed isn’t guaranteed. The “Last Updated” field at the topmost corner of the report shows when the last update happened.
- As of now there is no manual refresh that happens and the system updates the report automatically each day, starting at midnight UTC.
Conclusion:
- The insights dashboards available in “Knowledge Analytics” provide various charts and metrics that help the knowledge manager to improve the customer service performance for the organization.
- Various key performance indicators (KPIs) and grouping of search terms and knowledge articles with AI-driven insights provide effective reporting and an inbuilt way to improve knowledge management capabilities.